Privilege in the U.S. Senate
To explore the interactive version of the data visualization, please visit willy-v.itch.io/the-privilege-of-the-us-senate (in Safari browser for Mac users).
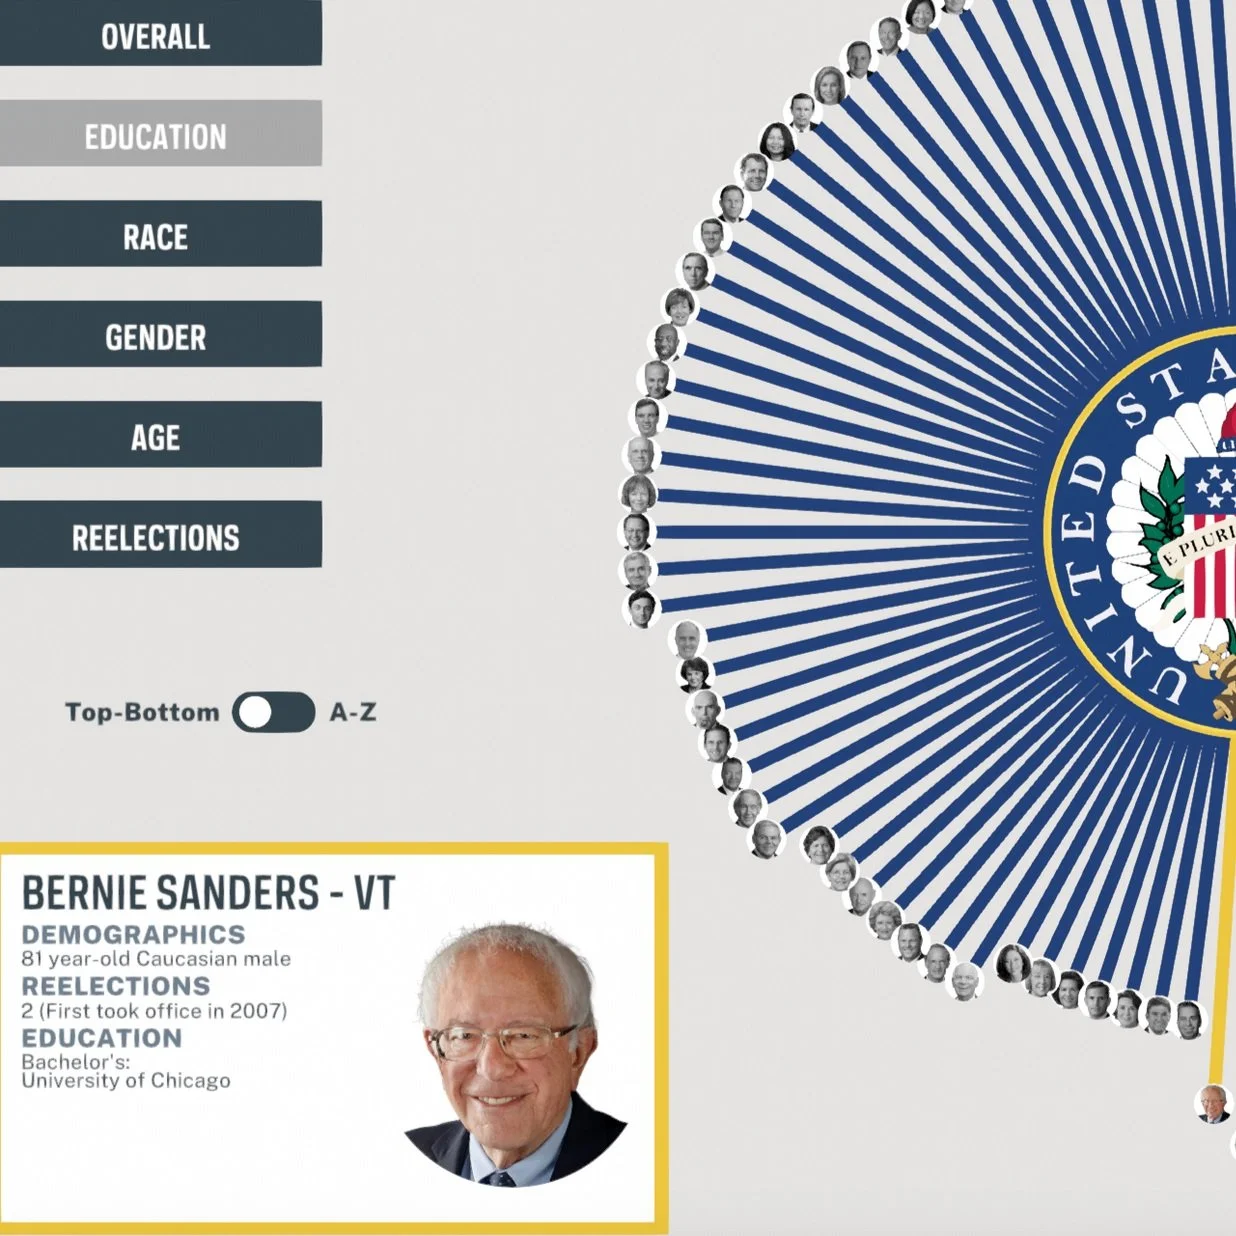
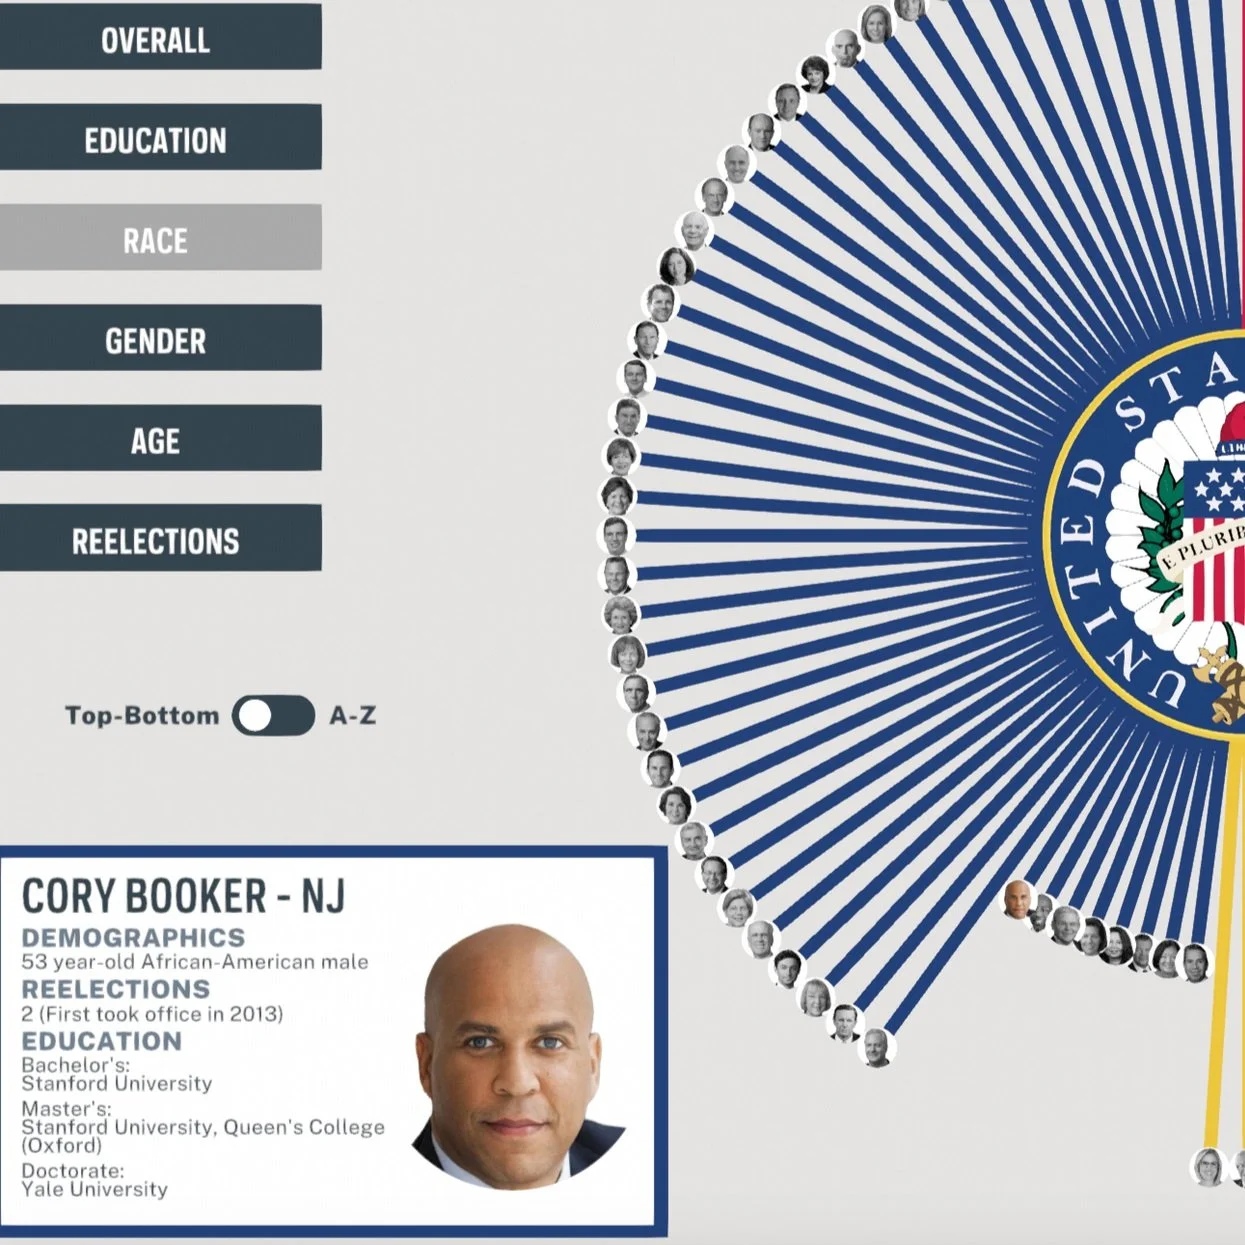
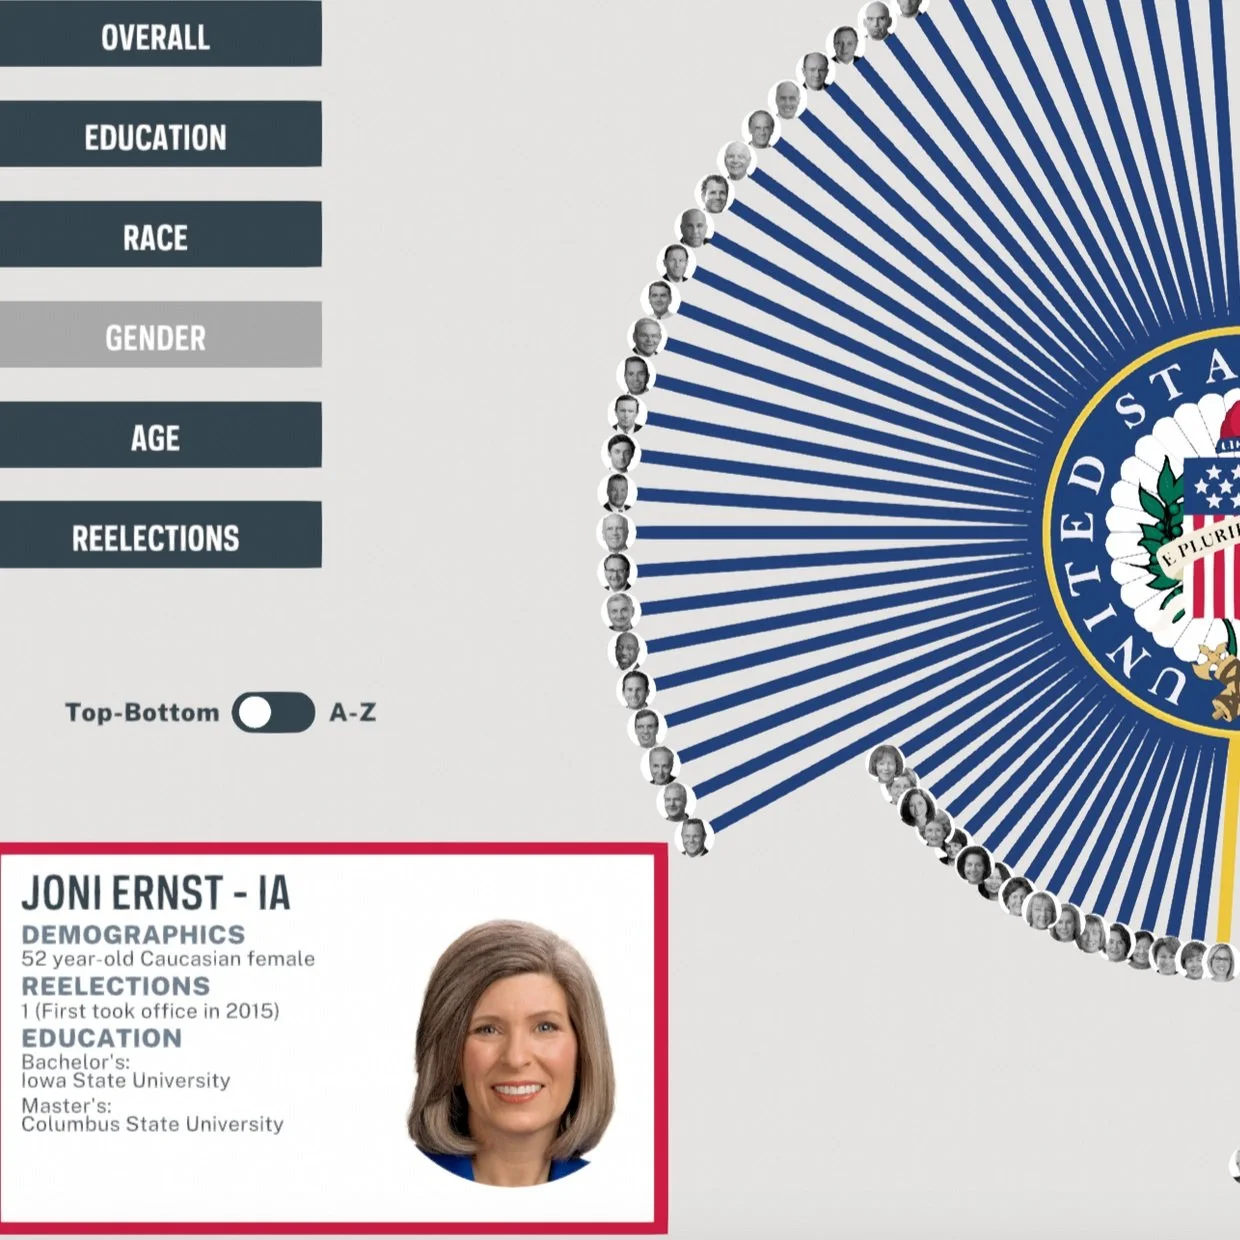
In my undergraduate data visualization course, I was tasked with creating a data visualization related to American politics. My classmate and I produced an interactive data visualization exploring the privilege of the U.S. Senate, broken down by education, race, gender, age, and reelection frequency.
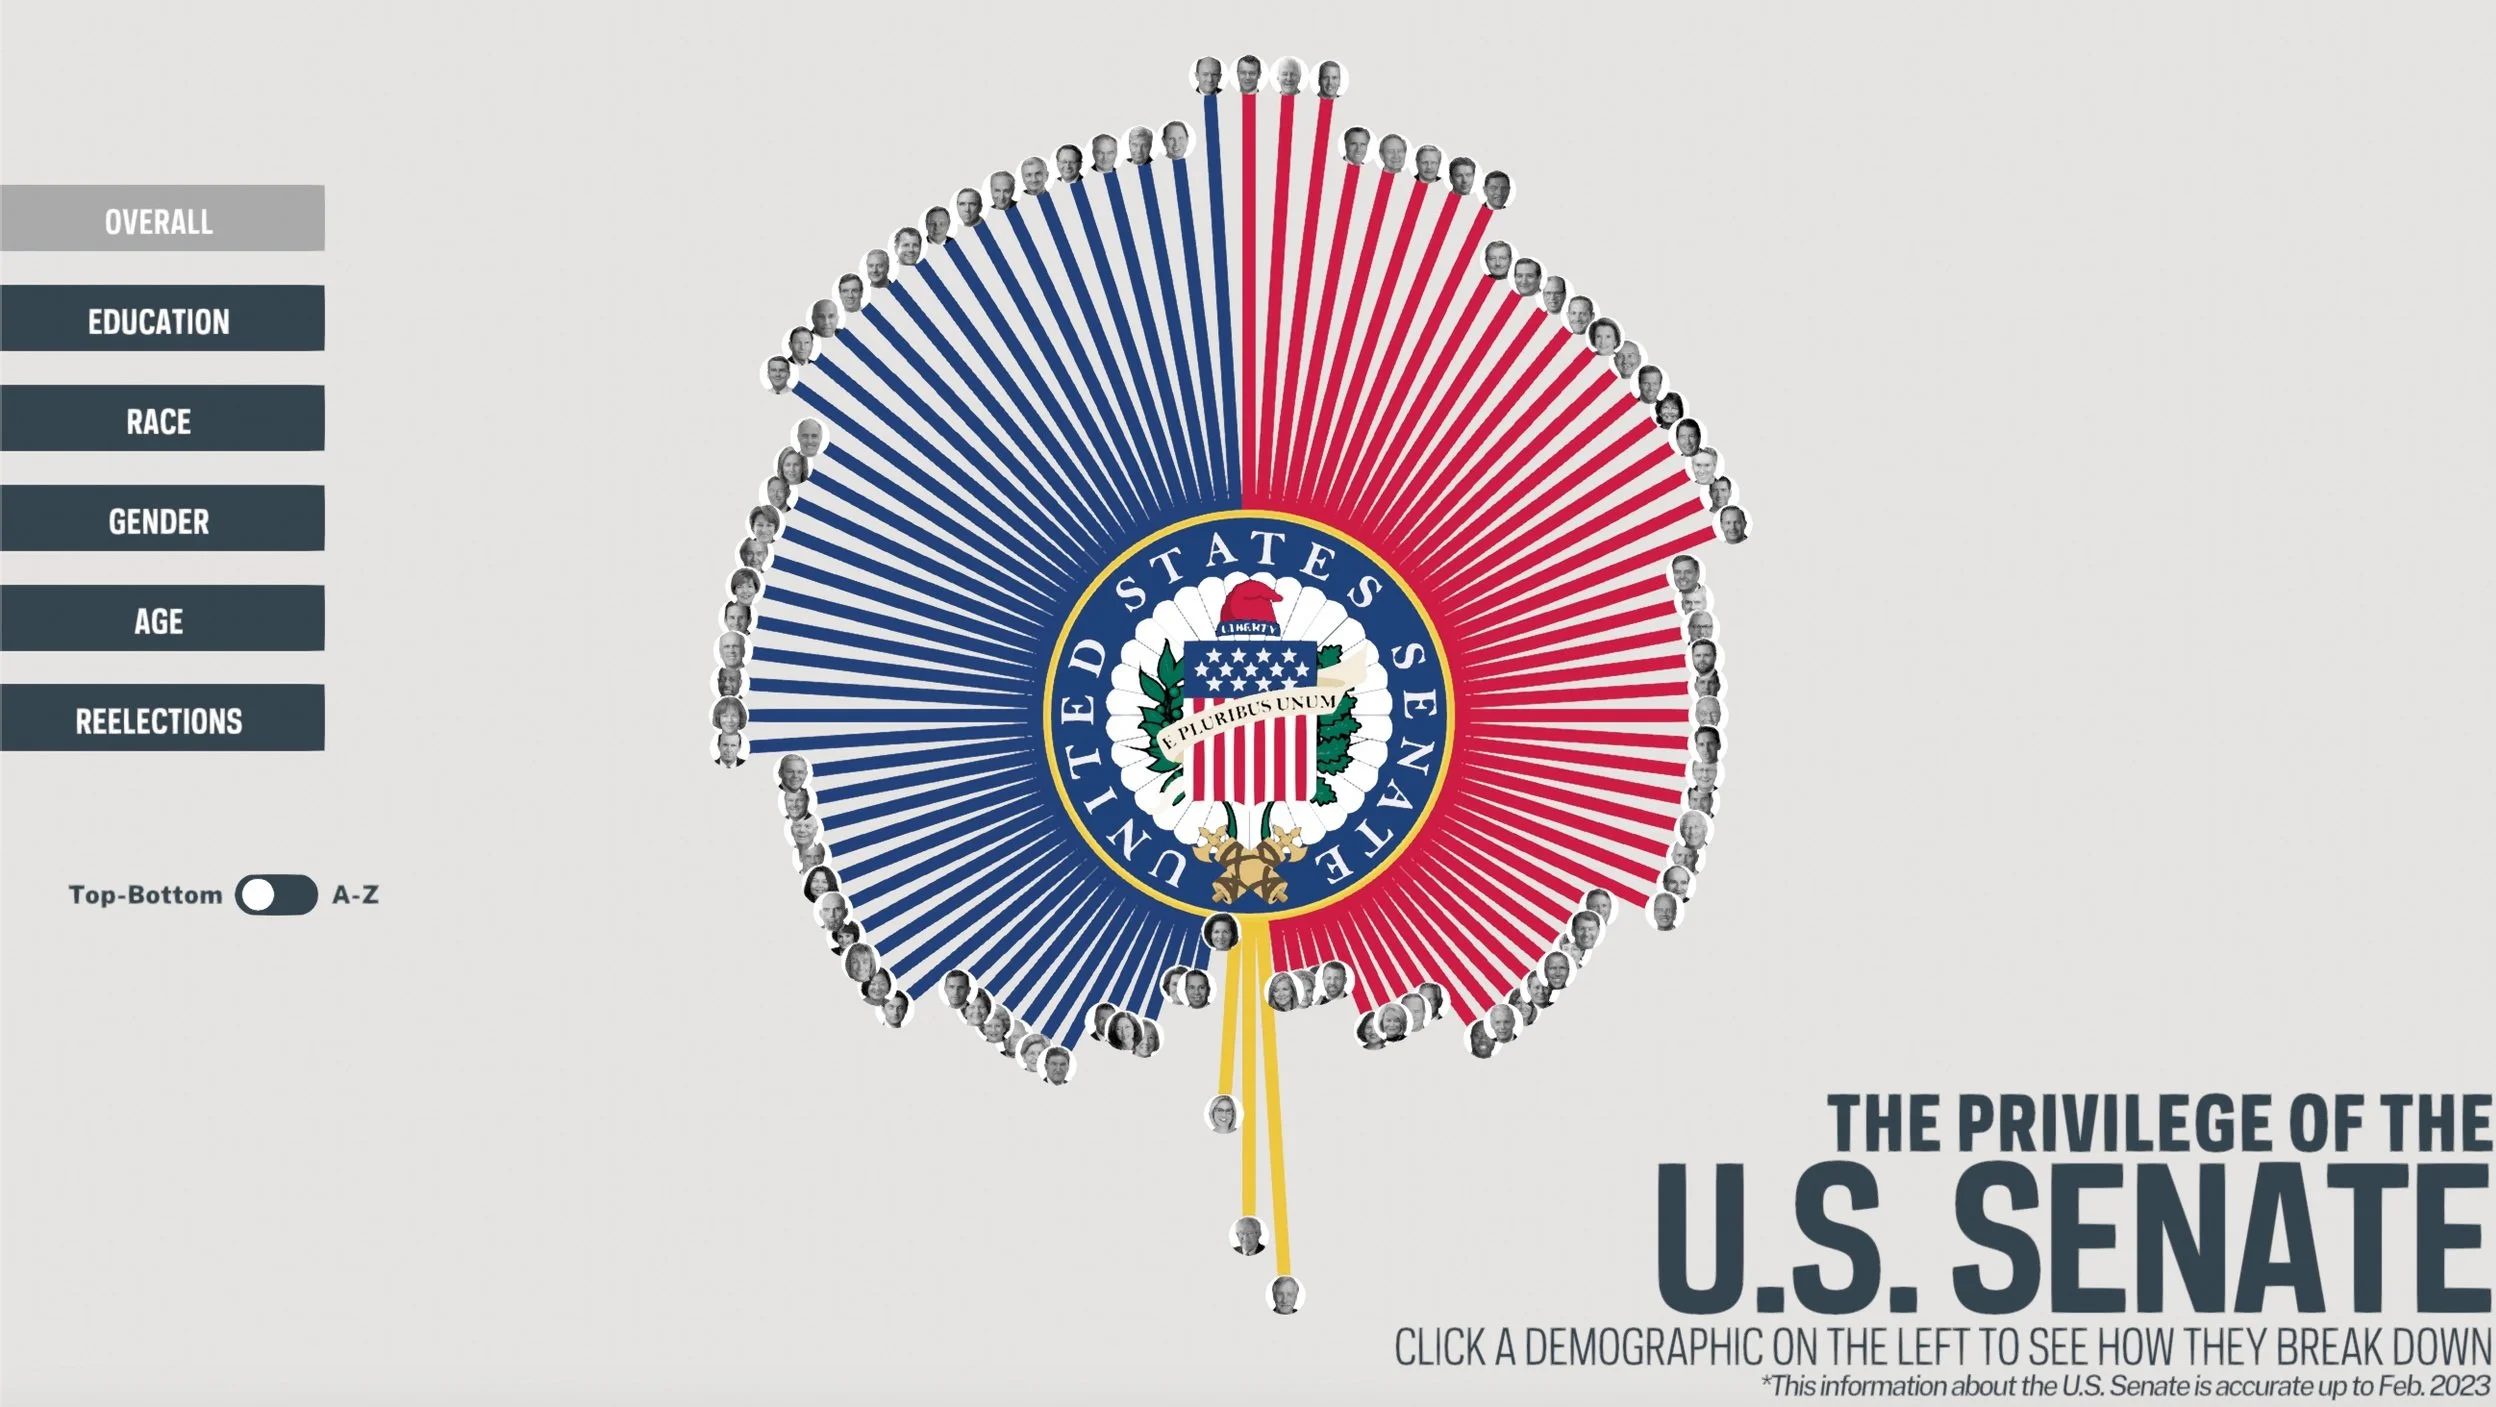

While the trends in the data are already pretty well established in many Americans’ minds—it should be a surprise to few that the U.S. Senate is overwhelmingly white, male, and older—this exercise reinforced the visual power of dynamic data visualizations. Wherever one stands in their understanding of the U.S. government’s demographic composition when they first view this graphic, the insights are immediate.
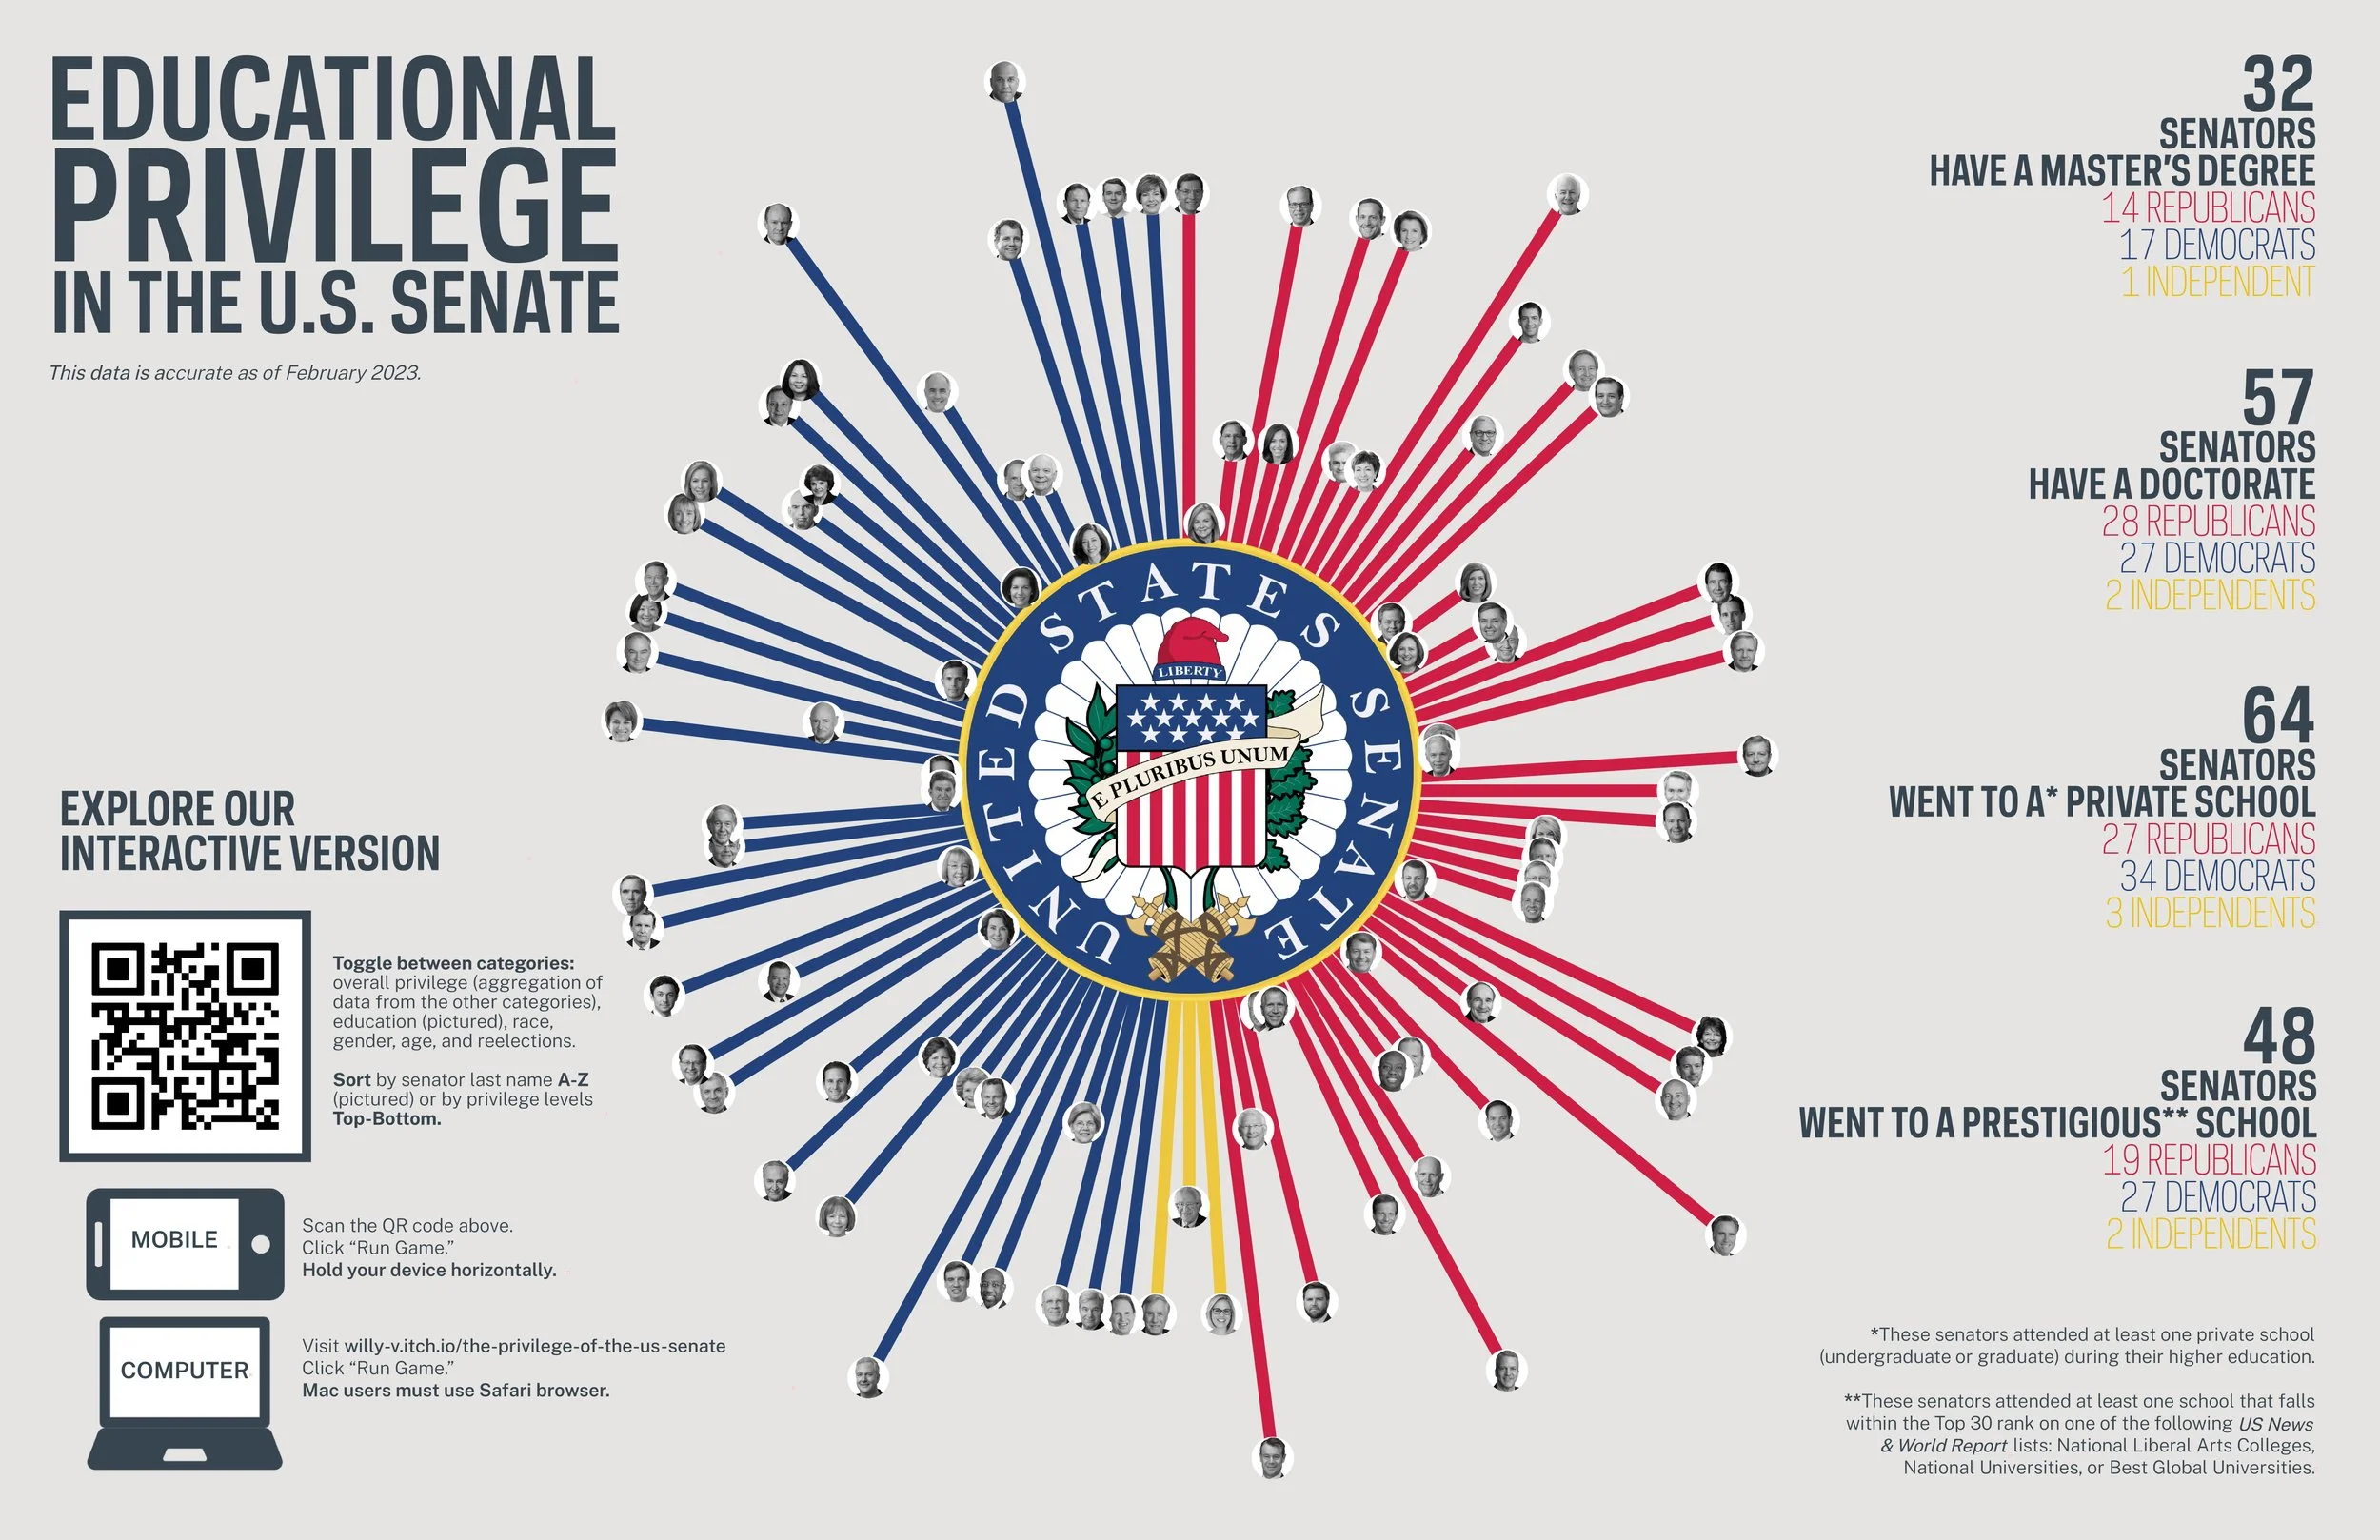
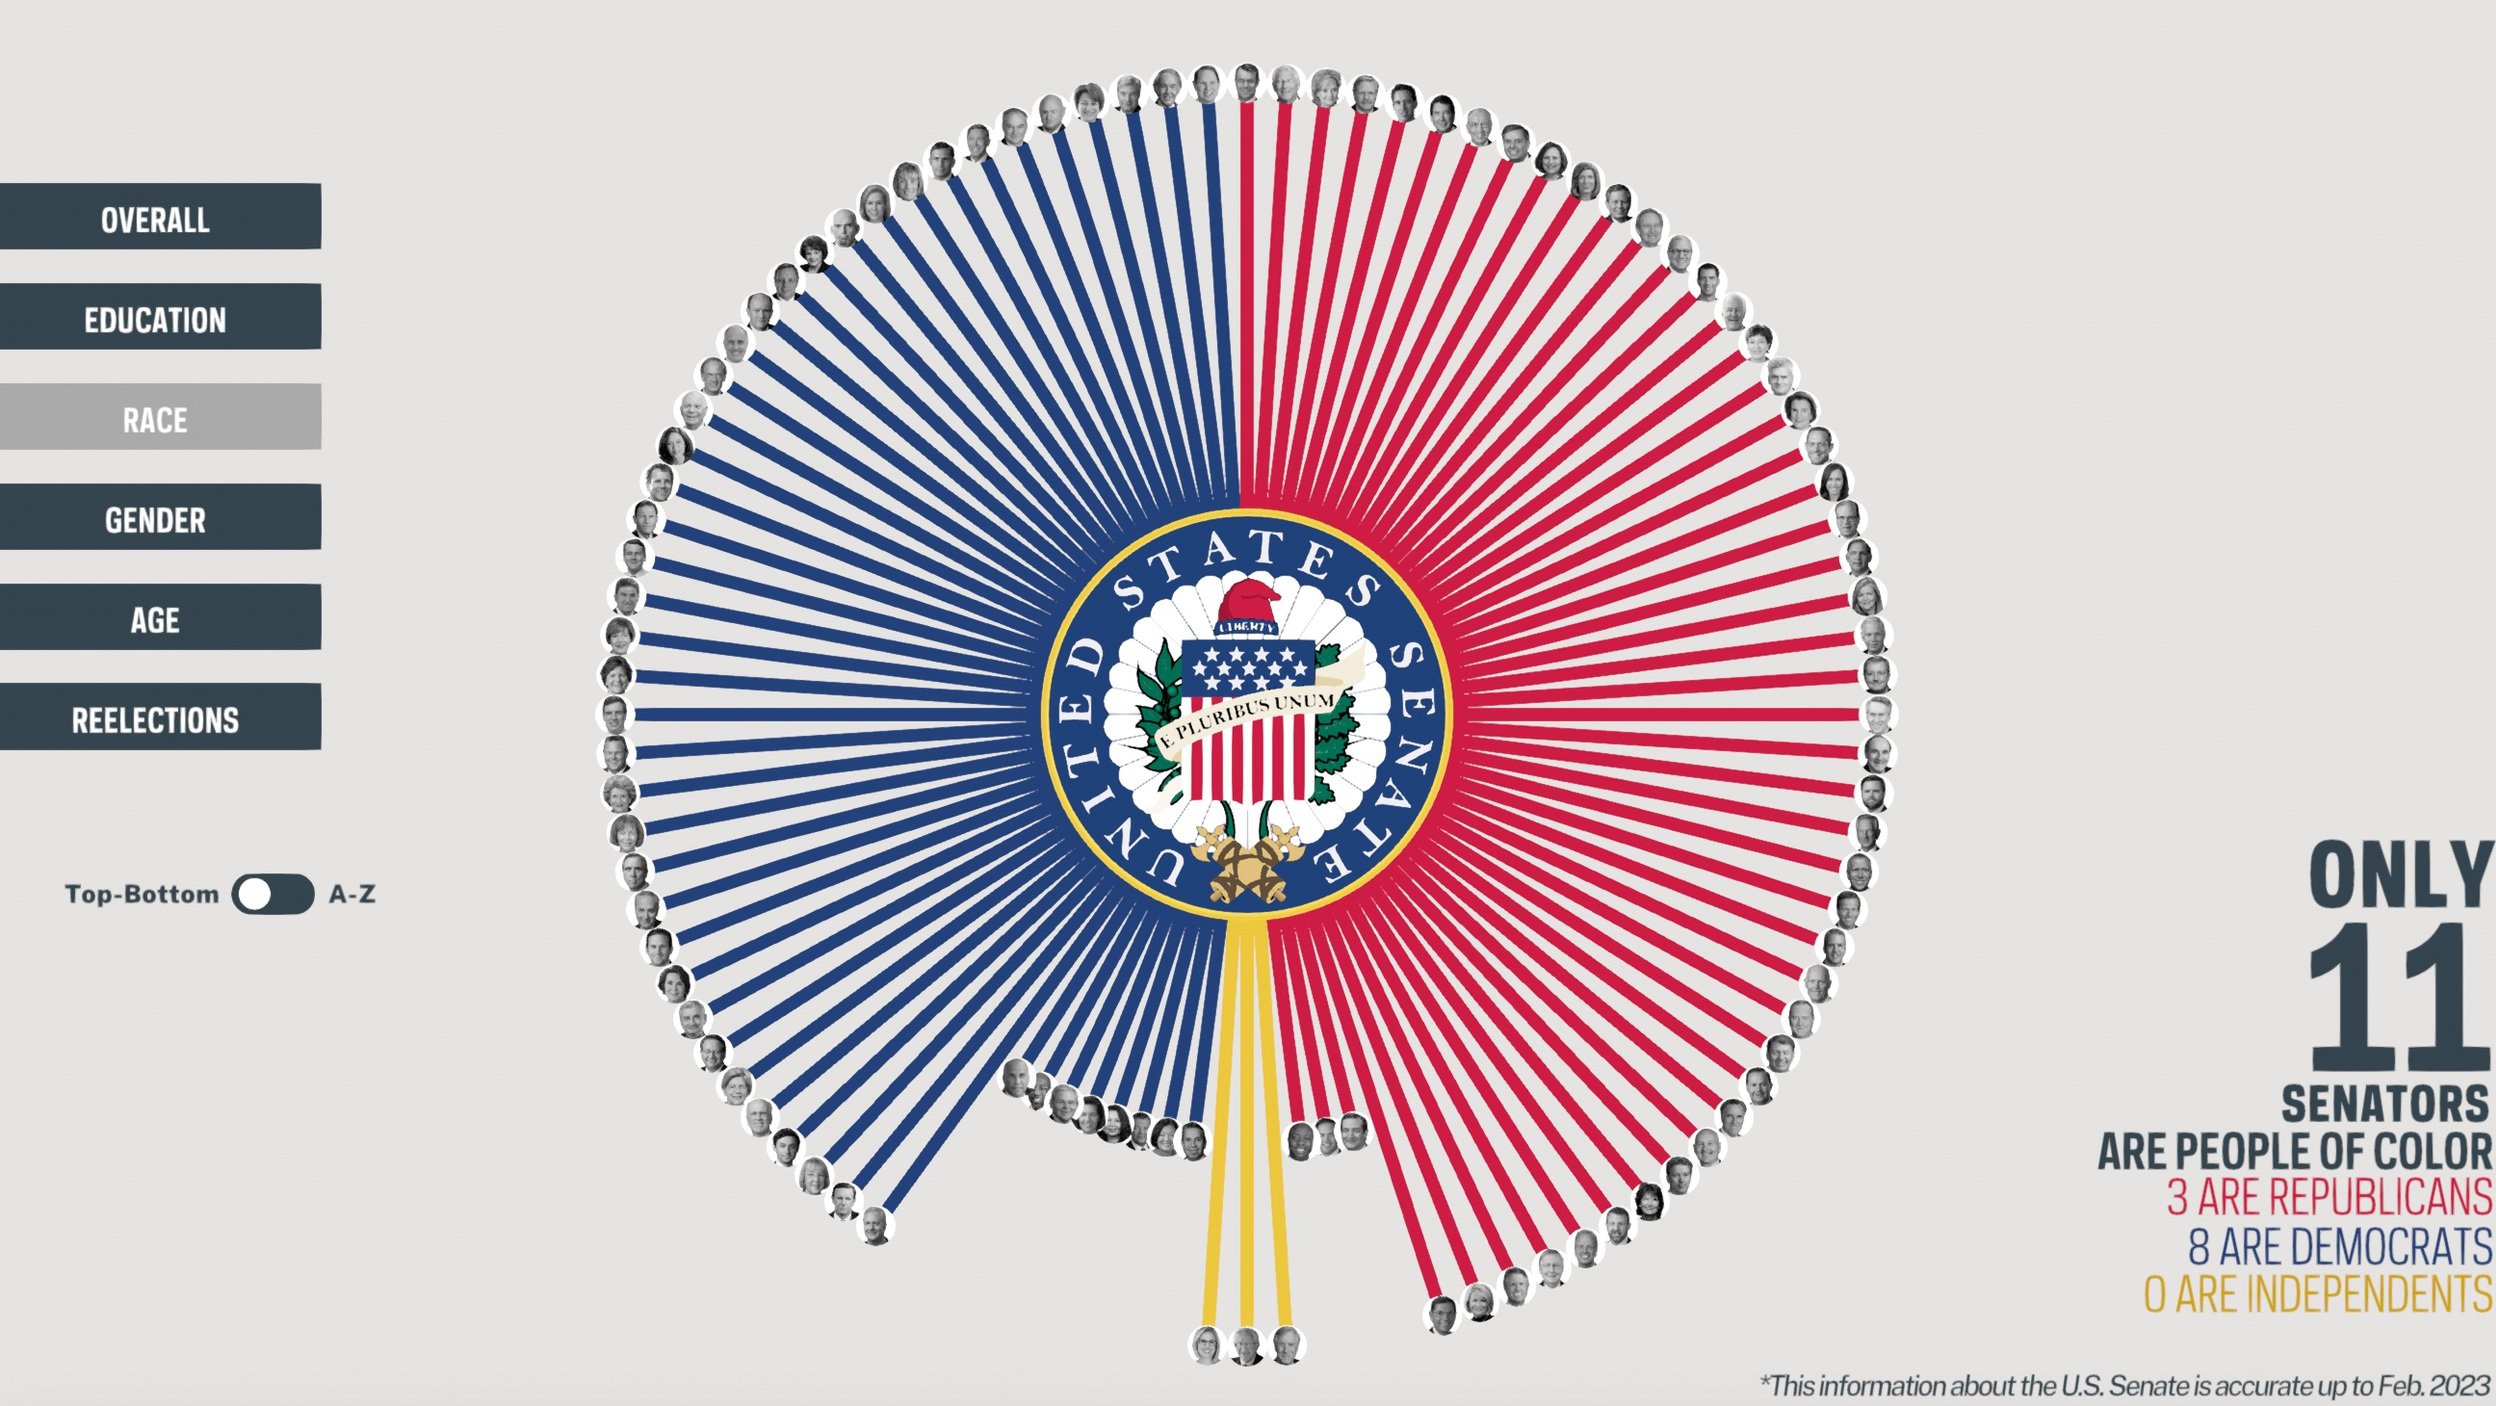
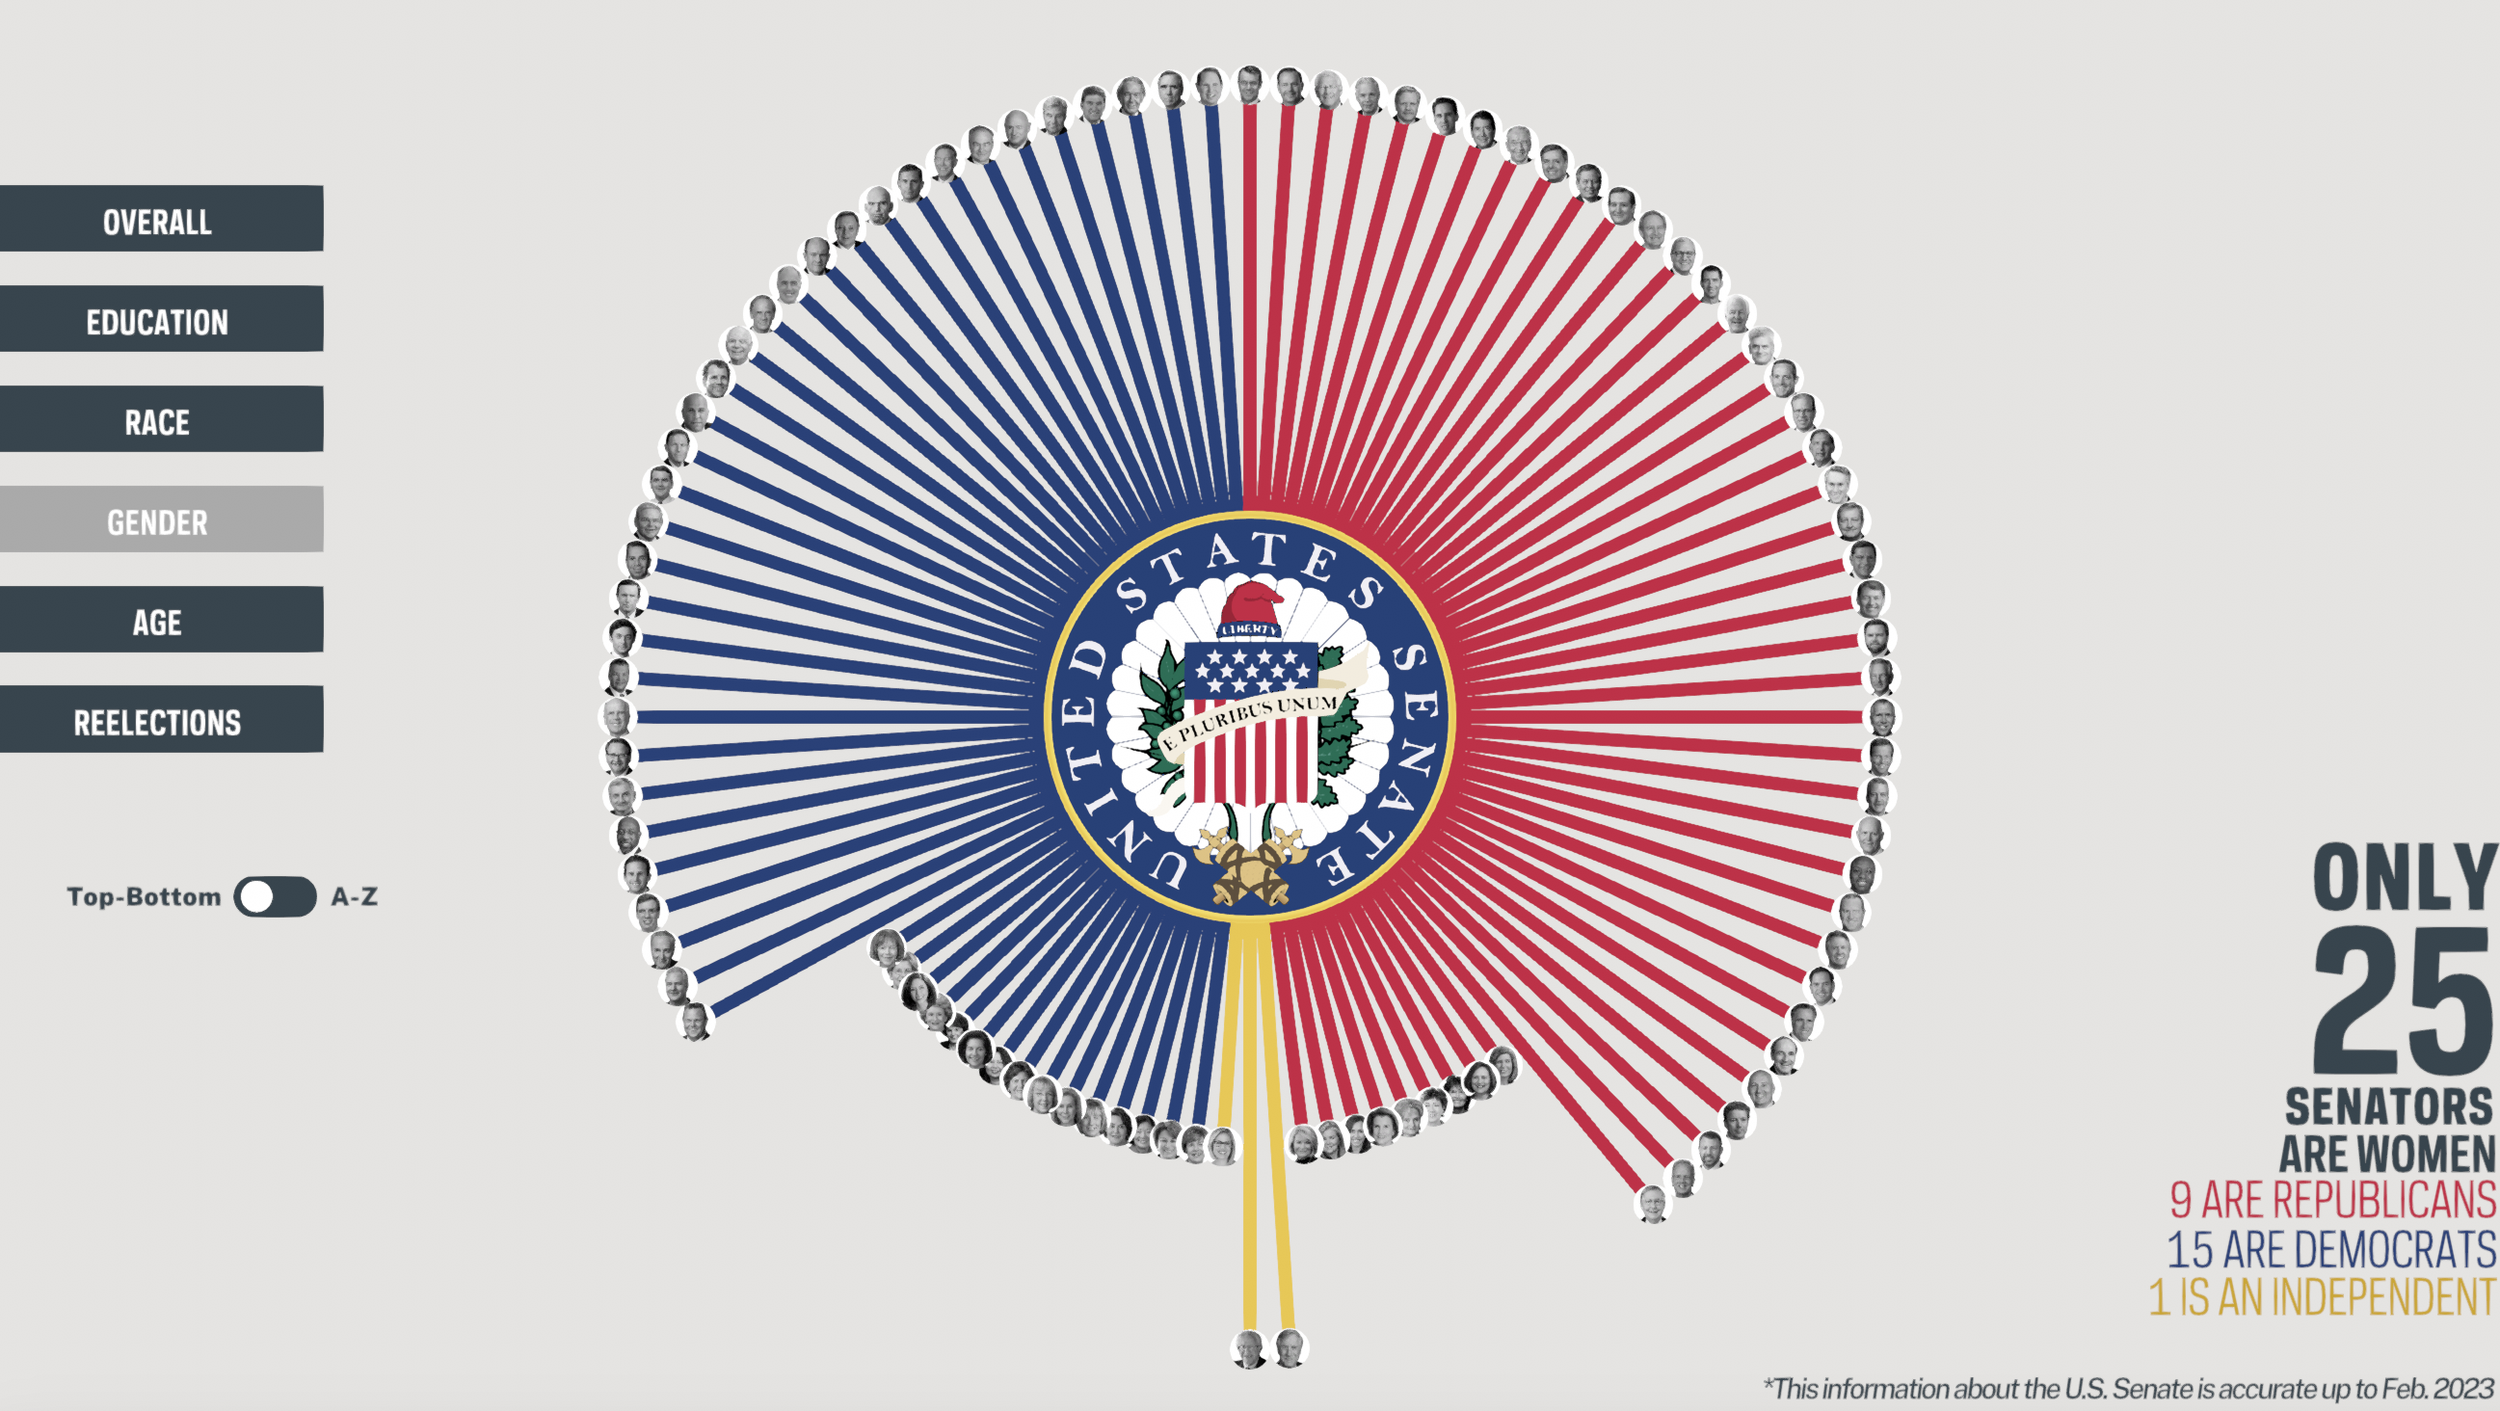
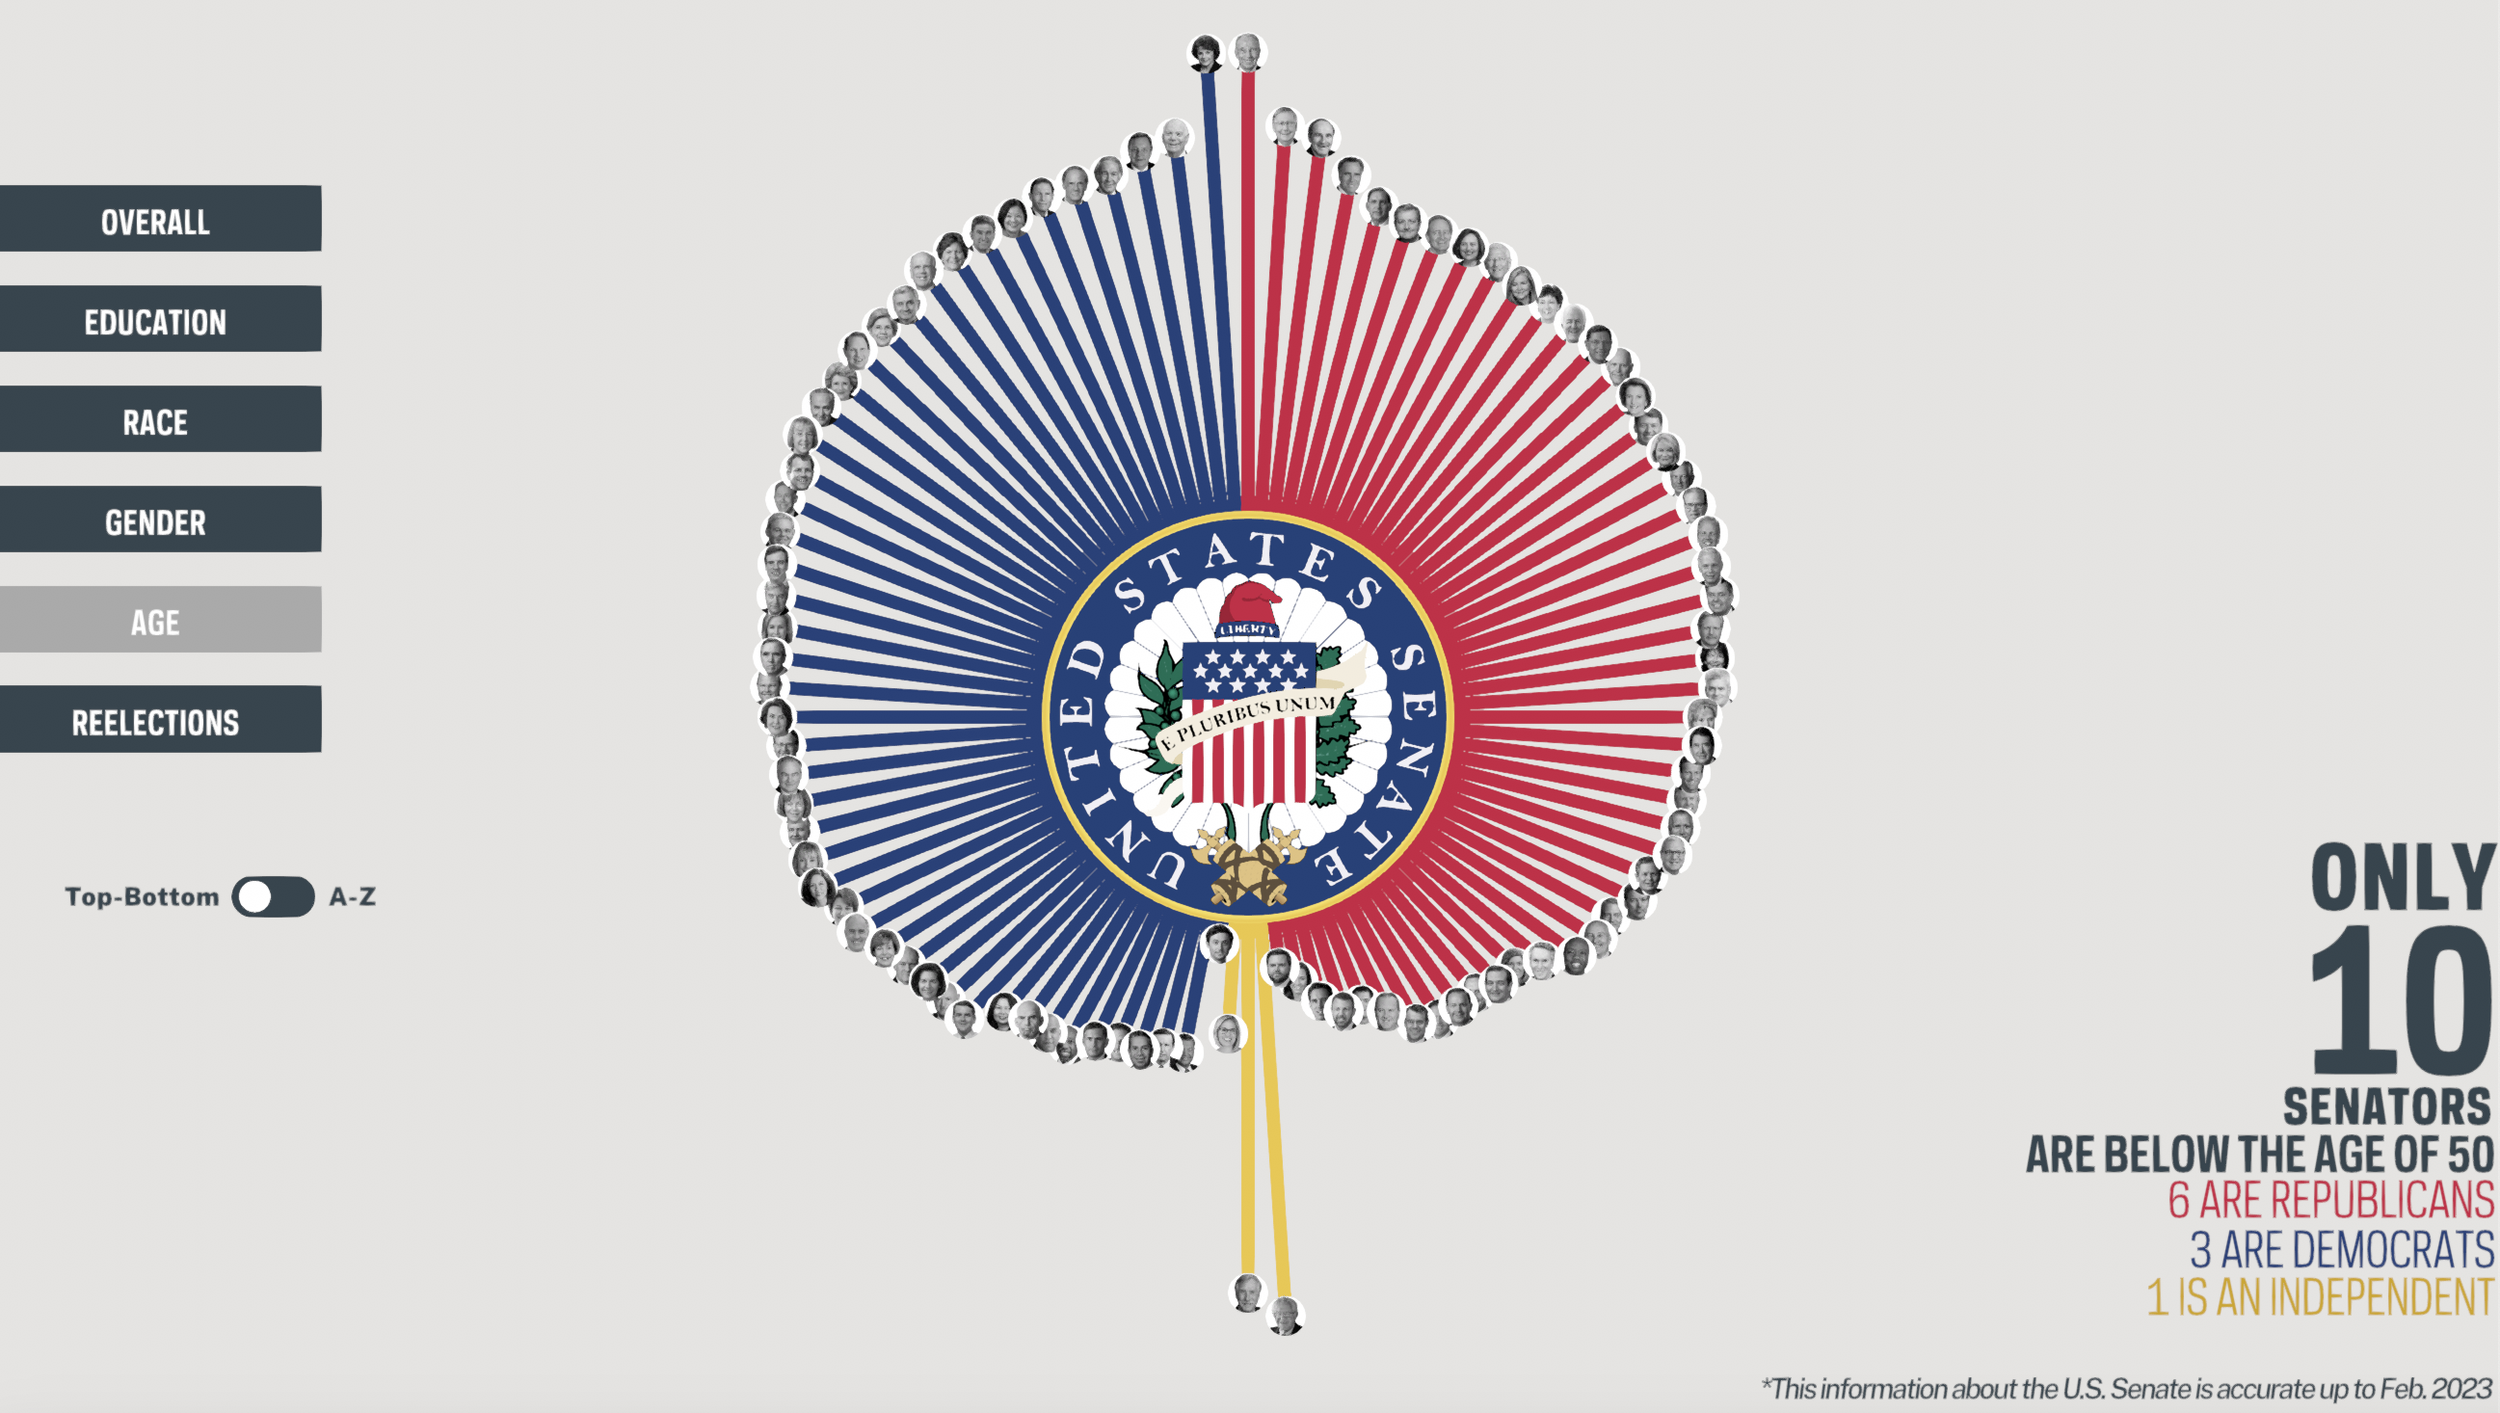
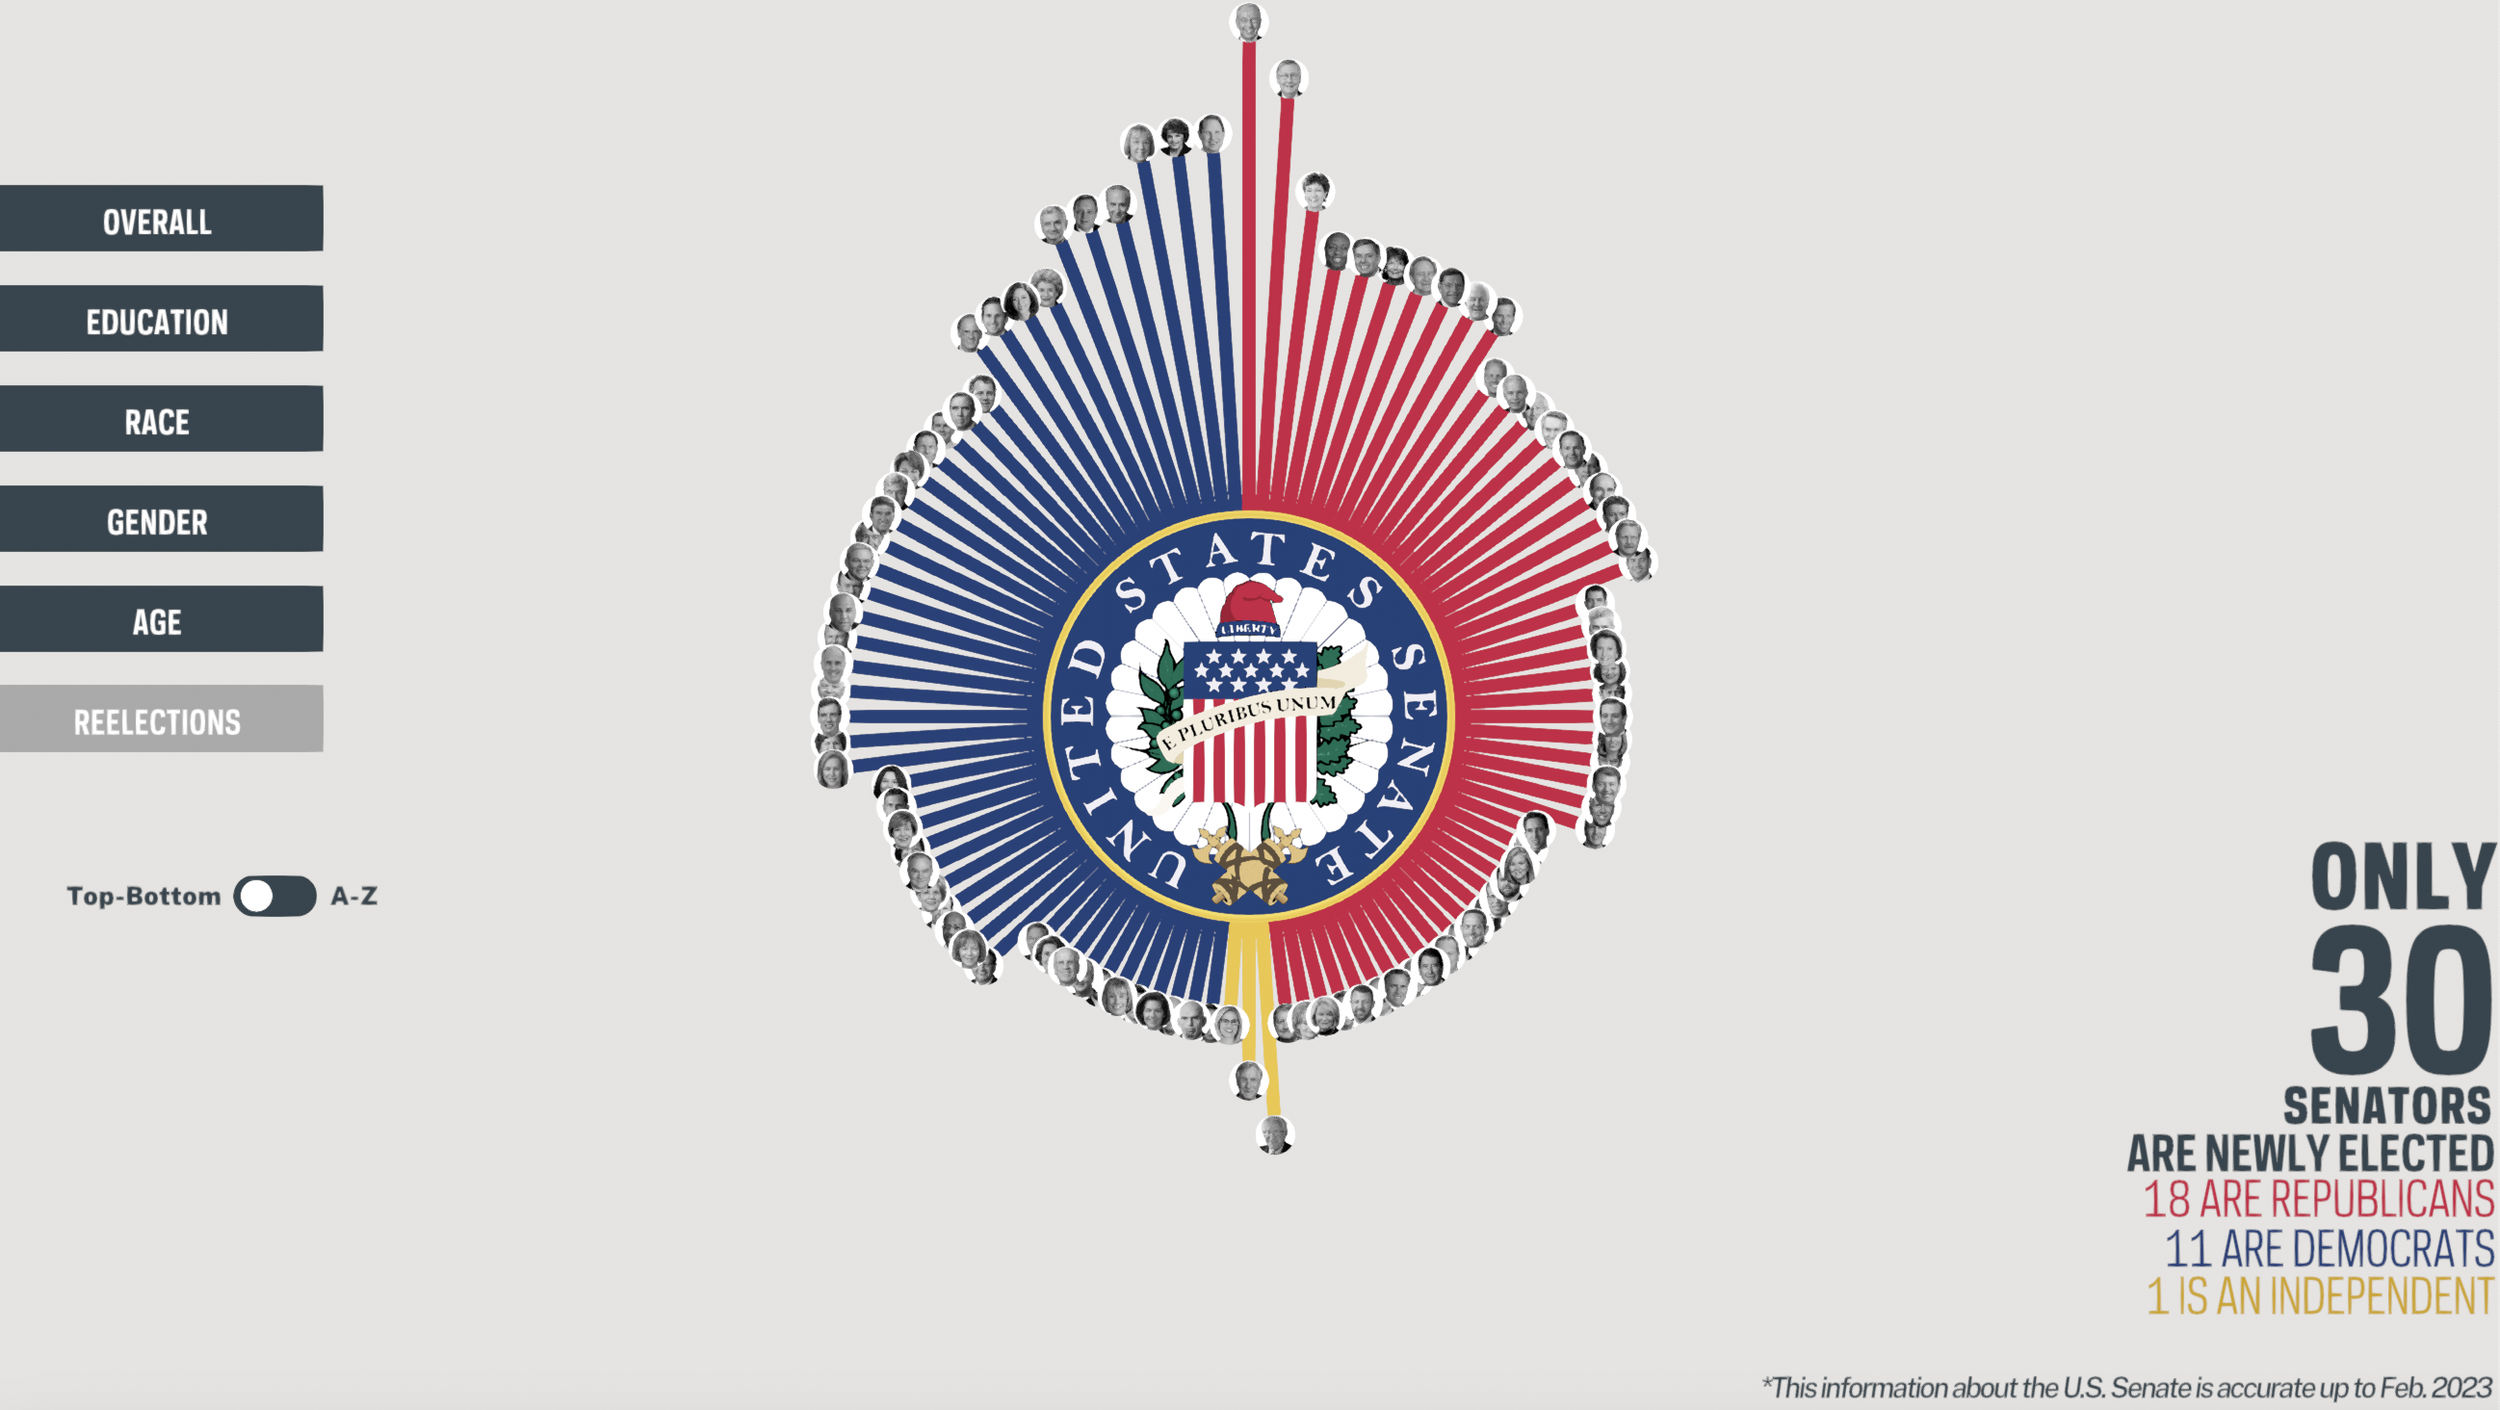
We chose to display the data in a sunburst chart, with differences in line length indicating differences in education level, race, gender, age, and number of reelections. The sunburst view reveals the stark minority-majority split for certain attributes of the Senate, particularly race and gender.
Reviewing this work several years after its completion, there are elements I would change. For one example, inclusion of the word “only” before the statistics that appear on the righthand side for the race, gender, age, and reelection views might be perceived to (1) inject a certain degree of bias/slant or (2) ultimately “tell” rather than “show” what the data already reveals.